
SMART monitoring will not catch every dying drive, but it catches enough of them to be worth setting up on a home server or NAS. Install smartmontools, let its smartd daemon run a short self-test every night and a long one every week, and have it email you or ping your phone when a drive reports trouble. Then learn the handful of numbers that actually matter, because most of what smartctl prints is noise.
Backblaze, which logs SMART data from tens of thousands of drives with the same smartmontools package, found that 76.7% of its failed hard drives showed a warning in the five attributes it tracks. The other 23.3% failed with no warning at all. SMART is an early warning system, not a guarantee, so it sits alongside redundancy and backups.
What SMART can and cannot tell you
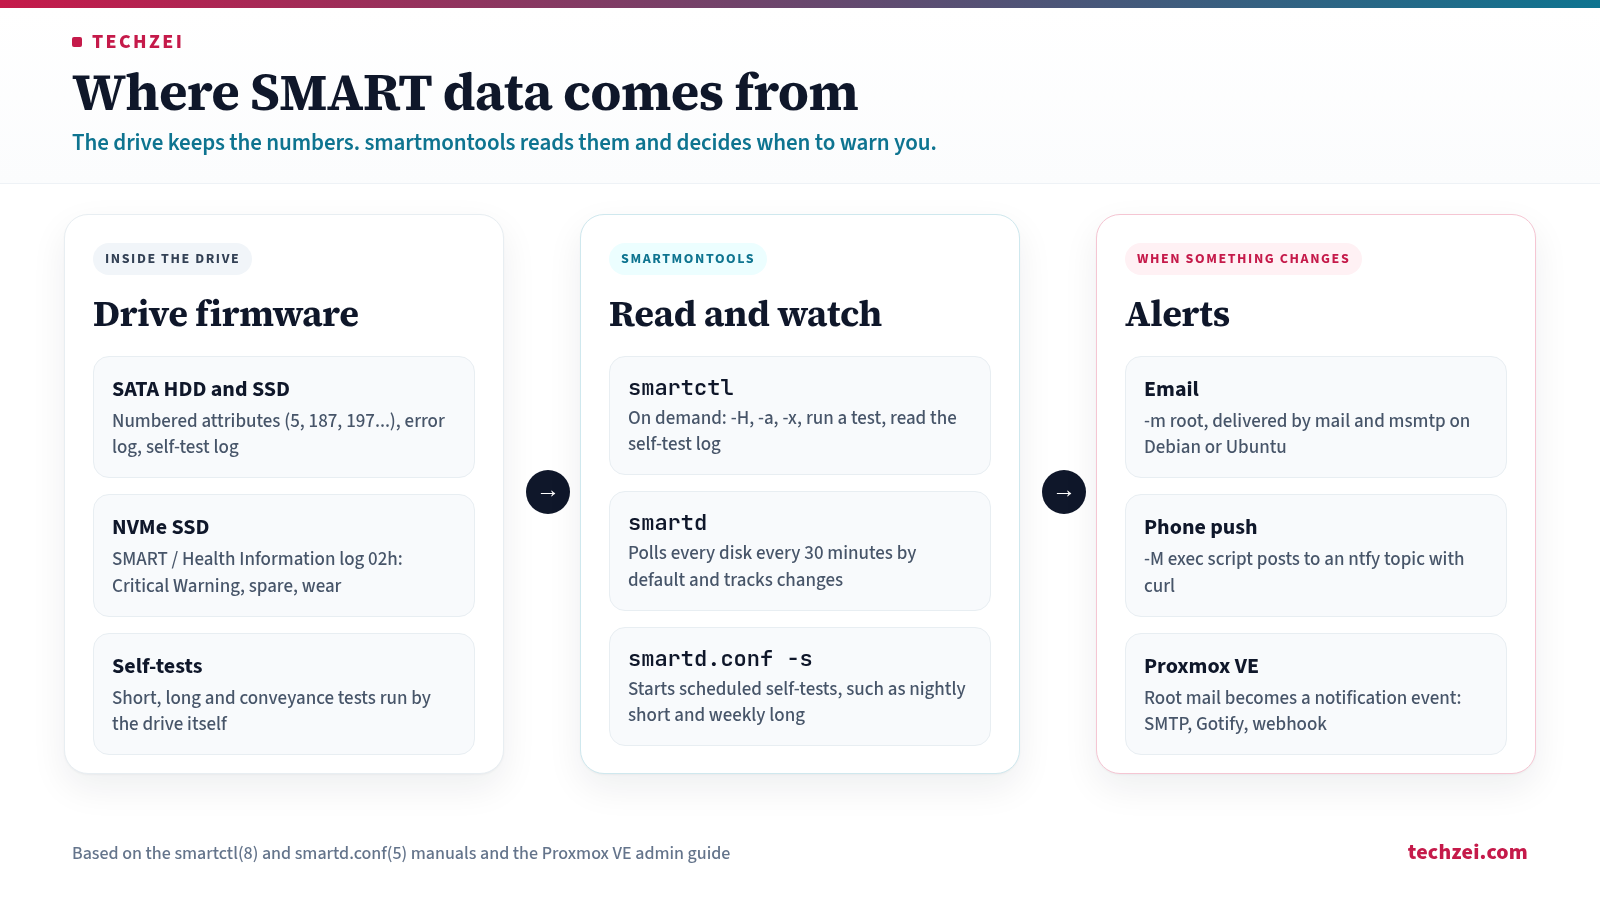
SMART (Self-Monitoring, Analysis and Reporting Technology) is firmware inside the drive that counts errors, tracks wear and runs self-tests on request. The smartmontools package gives you two tools to read it: smartctl for checking a drive by hand, and smartd, a daemon that polls every drive every 30 minutes by default and raises an alert when something changes.
Three limits are worth knowing before you trust the output:
- The overall health result is a blunt instrument. The smartctl manual says a failing status means the drive has failed or expects to within 24 hours. A drive can fail self-tests and still report PASSED, which the smartmontools FAQ says usually means an unreadable sector.
- ATA attributes are not standardised. According to the same FAQ, attribute numbers and meanings are vendor specific and were dropped from the ATA standard in 1998. smartmontools ships a drive database that names them for known models.
- Sudden failures happen. Electronics, firmware bugs and power events can kill a drive between two polls, so redundancy and a real backup still come first.
ATA attributes vs the NVMe health log
SATA hard drives and SSDs report SMART as numbered attributes, each with a normalised VALUE, a WORST value, a vendor THRESH and a RAW value. The attribute “fails” when VALUE drops to the threshold, but the raw value, the actual count of bad sectors or errors, is usually more useful.
NVMe drives work differently. The NVM Express specification defines a fixed SMART / Health Information log page (log identifier 02h) with the same fields on every drive: a Critical Warning byte, temperature, Available Spare, Percentage Used, Media and Data Integrity Errors and more. No attribute IDs or thresholds to decode, so NVMe health reads the same across brands.
| SATA HDD and SATA SSD | NVMe SSD | |
|---|---|---|
| Where health comes from | Vendor attributes plus the SMART RETURN STATUS command | SMART / Health Information log (02h), defined by the NVMe spec |
| What smartctl -H checks | The drive’s own pass or fail verdict | Whether any Critical Warning bit is set |
| Wear indicator | Vendor specific (for example attribute 177 or 231 on some SSDs) | Percentage Used, plus Available Spare against its threshold |
| Self-tests with smartctl | Short, long, conveyance, selective | Short and extended, from smartmontools 7.4 (marked experimental) |
| Self-tests scheduled by smartd | Yes | From smartmontools 7.5 (marked experimental) |
| Error log | ATA error log, read with smartctl -l error | Error Information log is lost on power cycles; the lifetime entry count is kept |
Step 1: Install smartmontools
On Debian and Ubuntu, one package gives you both tools, and the service starts automatically:
sudo apt update
sudo apt install smartmontools
smartctl -V
systemctl status smartmontools
Versions matter here because NVMe self-test support arrived recently. Debian 13 (trixie) ships smartmontools 7.4, with 7.5 in trixie-backports. Debian 12 has 7.3. Ubuntu 24.04 LTS has 7.4 and Ubuntu 26.04 LTS has 7.5. On Debian and Ubuntu the systemd unit is called smartmontools.service, with smartd.service as an alias.
On Fedora the package carries 7.5 on current releases, and the service is named smartd:
sudo dnf install smartmontools
sudo systemctl enable --now smartd
The packaged defaults are not the same. Debian’s /etc/smartd.conf contains one active line, DEVICESCAN -d removable -n standby -m root -M exec /usr/share/smartmontools/smartd-runner, which monitors everything but schedules no self-tests. Fedora keeps its file at /etc/smartmontools/smartd.conf and only checks the health status (-H) by default. You will replace both lines in Step 6.
Proxmox VE already includes smartmontools. Its admin guide says smartd is active and enabled by default, scans SATA and NVMe devices every 30 minutes and mails root when it finds a problem. Proxmox turns those root mails into notification events, so you route them from Datacenter > Notifications to SMTP, Gotify or a webhook instead of setting up a mailer. Proxmox VE 9 is based on Debian 13 and has the same 7.4 package.
TrueNAS 25.10 and later took a different path. Its Drive Health Management page says the middleware polls SMART every 90 minutes and raises alerts itself; the old test scheduler is gone, so regular self-tests become cron jobs running smartctl -t short or -t long.
Install smartmontools on the machine that physically owns the disks. Debian’s unit file has ConditionVirtualization=no, so smartd will not start inside a VM, and the FAQ notes that virtual disks do not expose SMART anyway.
Step 2: Find your drives and read their health
List what smartctl can see, and note the stable /dev/disk/by-id/ names, which include model and serial and do not shuffle between boots like /dev/sda:
sudo smartctl --scan
ls -l /dev/disk/by-id/ | grep -v part
Four commands cover almost everything you will do by hand:
sudo smartctl -i /dev/sda   # model, serial, firmware, SMART supported and enabled
sudo smartctl -H /dev/sda   # overall health verdict
sudo smartctl -a /dev/sda   # health, attributes, error log, self-test log
sudo smartctl -x /dev/sda   # everything, including device statistics
The manual describes -a as no longer recommended for ATA disks because it skips information that needs 48-bit ATA commands, and the FAQ asks for -x output in bug reports. If -i says SMART is disabled, smartctl -s on /dev/sda enables it.
Here is an illustrative excerpt of smartctl -a on a SATA hard drive. The values are made up to show what to look for; your drive will print different names and numbers.
SMART overall-health self-assessment test result: PASSED

Vendor Specific SMART Attributes with Thresholds:
ID# ATTRIBUTE_NAME          FLAG     VALUE WORST THRESH TYPE      UPDATED  WHEN_FAILED RAW_VALUE
  5 Reallocated_Sector_Ct   0x0033   100   100   005    Pre-fail  Always       -       8
  9 Power_On_Hours          0x0032   093   093   000    Old_age   Always       -       31042
187 Reported_Uncorrect      0x0032   100   100   000    Old_age   Always       -       0
188 Command_Timeout         0x0032   100   100   000    Old_age   Always       -       0
194 Temperature_Celsius     0x0002   171   171   000    Old_age   Always       -       35
197 Current_Pending_Sector  0x0022   100   100   000    Old_age   Always       -       2
198 Offline_Uncorrectable   0x0008   100   100   000    Old_age   Offline      -       0
199 UDMA_CRC_Error_Count    0x000a   200   200   000    Old_age   Always       -       0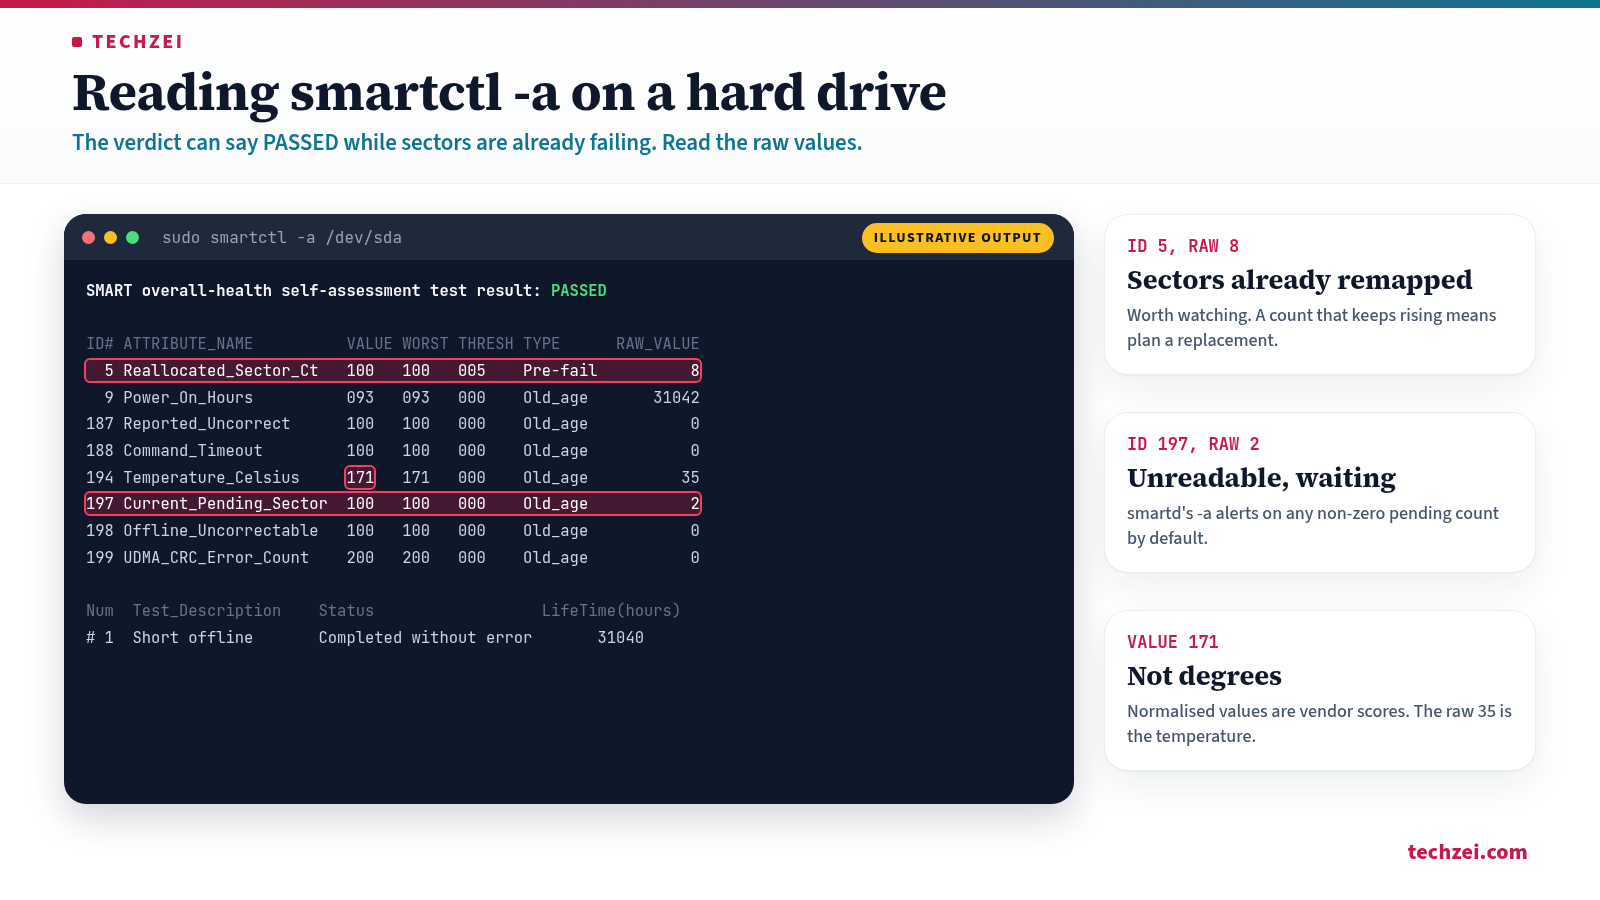
Here the health line says PASSED, yet the drive has 8 reallocated sectors and 2 pending ones, exactly the case where the verdict alone would mislead you. Read the RAW_VALUE column, and ignore the normalised temperature value (171), which is not degrees.
Step 3: Read NVMe health with smartctl
NVMe drives use the controller name (/dev/nvme0) or a namespace (/dev/nvme0n1). The same -a option prints the health log:
sudo smartctl -a /dev/nvme0An illustrative excerpt, again with example values:
SMART overall-health self-assessment test result: PASSED

SMART/Health Information (NVMe Log 0x02)
Critical Warning:                   0x00
Temperature:                        41 Celsius
Available Spare:                    100%
Available Spare Threshold:          10%
Percentage Used:                    3%
Data Units Written:                 41,632,118 [21.3 TB]
Power On Hours:                     9,874
Unsafe Shutdowns:                   37
Media and Data Integrity Errors:    0
Error Information Log Entries:      12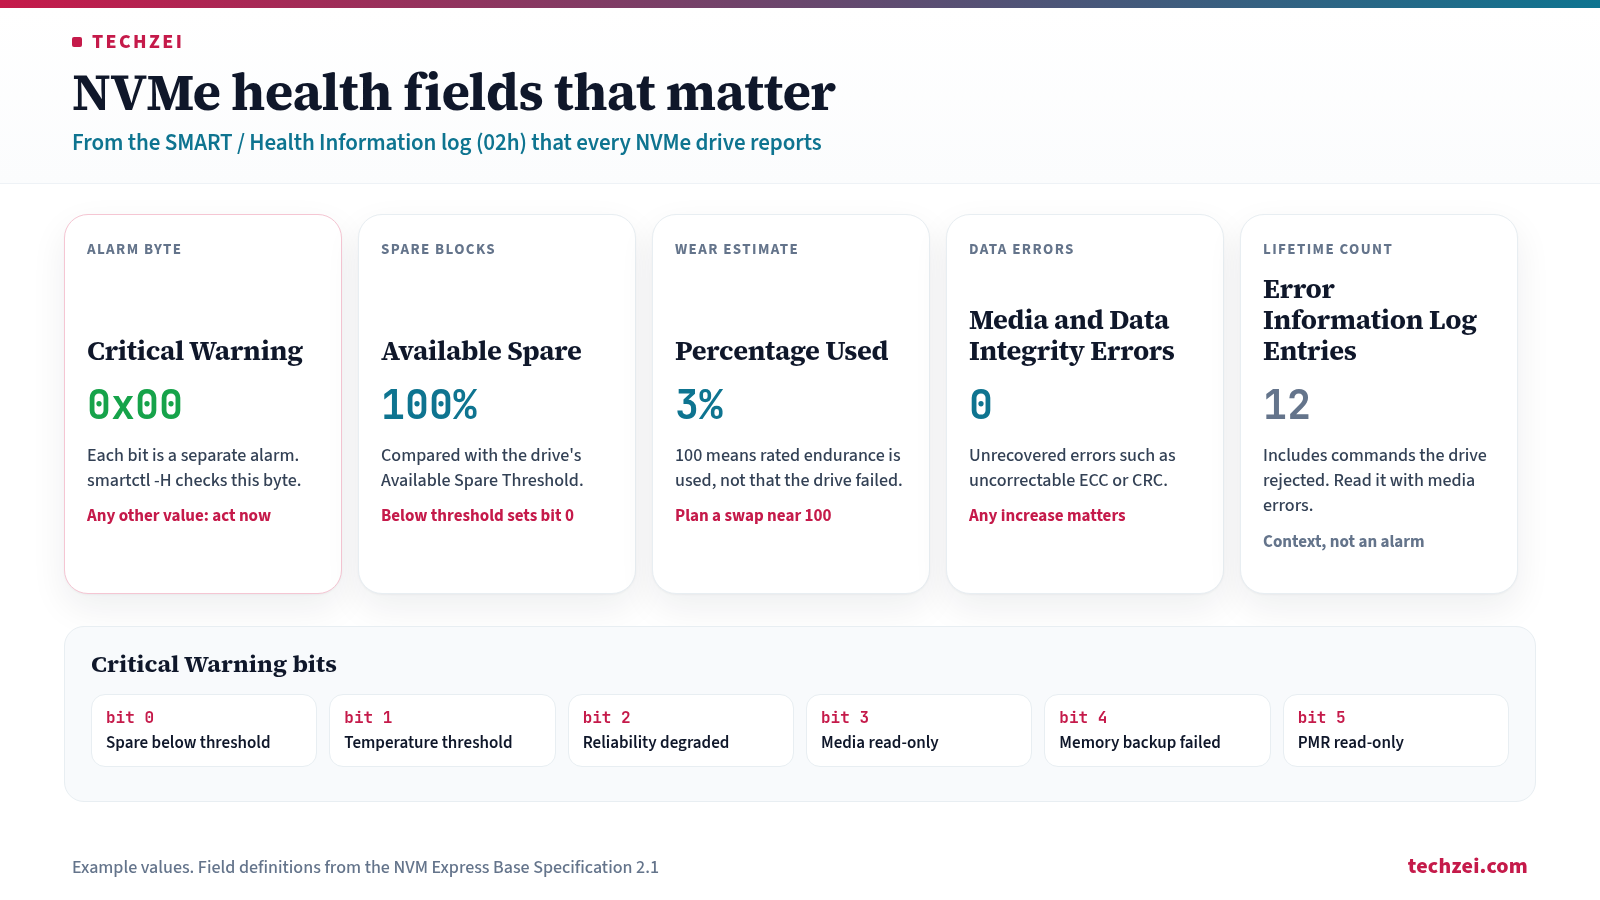
Five fields deserve your attention, and the NVMe base specification defines each of them:
- Critical Warning should be
0x00. Each bit is a separate alarm: bit 0 means available spare has fallen below its threshold, bit 1 a temperature threshold, bit 2 degraded reliability from media or internal errors, bit 3 that the media is now read-only, and bit 4 a failed volatile memory backup. Any non-zero value is serious. This byte is whatsmartctl -Hand smartd’s-Hcheck on NVMe. - Available Spare is the remaining spare capacity as a percentage. When it drops below Available Spare Threshold, the drive sets warning bit 0.
- Percentage Used is the vendor’s estimate of rated endurance consumed. The spec says 100 means the estimated endurance is used up but does not necessarily mean failure, and the value can go above 100 (capped at 255).
- Media and Data Integrity Errors counts unrecovered data integrity errors such as uncorrectable ECC or CRC failures. On a healthy drive it should stay at zero.
- Error Information Log Entries is a lifetime count that also includes commands the drive rejected, so slow growth with zero media errors is usually not a drive fault.
Unsafe Shutdowns counts power cuts without a clean shutdown. It does not predict failure, but a high number on a home server is a good argument for a UPS.
Step 4: Drives in USB enclosures and docks
USB enclosures sit between the disk and the operating system and translate commands. smartctl usually detects a SCSI to ATA Translation (SAT) bridge on its own, but if it reports that it cannot open the device or sees no SMART data, tell it the type:
sudo smartctl -d sat -a /dev/sdb          # SATA disk in a USB enclosure
sudo smartctl -d sntjmicron -a /dev/sdc   # NVMe in a JMicron USB enclosure
sudo smartctl -d sntrealtek -a /dev/sdc   # NVMe in a Realtek USB enclosure
sudo smartctl -d sntasmedia -a /dev/sdc   # NVMe in an ASMedia USB enclosure
The same -d values work in smartd.conf. Some bridges pass nothing through, and the smartmontools FAQ notes that long self-tests behind USB bridges often get aborted when the host puts the drive into standby. For a disk that holds important data, a SATA port or a proper HBA is the better home.
Step 5: Run short, long and conveyance self-tests
Self-tests run inside the drive’s firmware, so you can keep using the system while they run, although the FAQ warns that some drives slow down noticeably. Start with a short test:
sudo smartctl -c /dev/sda          # shows estimated test durations
sudo smartctl -t short /dev/sda    # usually under ten minutes
sudo smartctl -t long /dev/sda     # tens of minutes to many hours
sudo smartctl -t conveyance /dev/sda   # ATA only, checks for shipping damage
sudo smartctl -l selftest /dev/sda # read the results
sudo smartctl -X /dev/sda          # abort a running test
The short test checks electrical and mechanical performance and a sample of reads. The long (extended) test reads the whole surface, so on a large hard drive it can take many hours; smartctl -c prints the drive’s own estimate. The conveyance test looks for transport damage, which makes it a sensible first command on a drive that just arrived by courier.
Reading the log is simple. This illustrative example shows a clean short test and a long test that hit an unreadable sector:
SMART Self-test log structure revision number 1
Num  Test_Description    Status                  Remaining  LifeTime(hours)  LBA_of_first_error
# 1  Short offline       Completed without error       00%     31040         -
# 2  Extended offline    Completed: read failure       90%     30876         1937502216
A “Completed: read failure” line with an LBA means the drive found a sector it could not read. Treat it as a real warning even if the health verdict says PASSED. On NVMe, smartctl -t short, -t long and -l selftest work from smartmontools 7.4, on drives that support the NVMe self-test command.
Step 6: Schedule self-tests and monitoring in smartd.conf
Open the config file (/etc/smartd.conf on Debian, Ubuntu and Proxmox; /etc/smartmontools/smartd.conf on Fedora), comment out the existing DEVICESCAN line, and add your own. On Debian, Ubuntu and Proxmox:
DEVICESCAN -a -d removable -n standby -s (S/../.././02|L/../../6/03) -m root -M exec /usr/share/smartmontools/smartd-runnerOn Fedora, keep its notification helper in place of the Debian runner:
DEVICESCAN -a -n standby,10,q -s (S/../.././02|L/../../6/03) -m root -M exec /usr/libexec/smartmontools/smartdnotifyHere is what each directive does, according to the smartd.conf manual:
DEVICESCANapplies the directives to every disk found. smartd ignores lines after it, so per-disk lines go above it.-aturns on the full monitoring set: health status, failed usage attributes, attribute tracking, increases in the error and self-test logs, self-test status, and alerts for non-zero attribute 197 (-C 197) and 198 (-U 198).-d removablelets smartd keep running if a listed device is missing at startup.-n standbyskips checks while a disk is spun down, so smartd does not wake it every 30 minutes. A test due during standby runs once the disk wakes.-m rootsends warnings to root, and-M execchooses the program that delivers them.
The -s value is a regular expression matched against a 12-character string, T/MM/DD/d/HH: test type (L long, S short, C conveyance, O offline), month, day of month, day of week (1 is Monday, 7 is Sunday) and hour. A dot matches any character, so S/../.././02 means a short test every day in the 2 am hour, and L/../../6/03 means a long test every Saturday in the 3 am hour. Always use two digits for month, day and hour; the manual warns that a single digit makes the match fail silently.
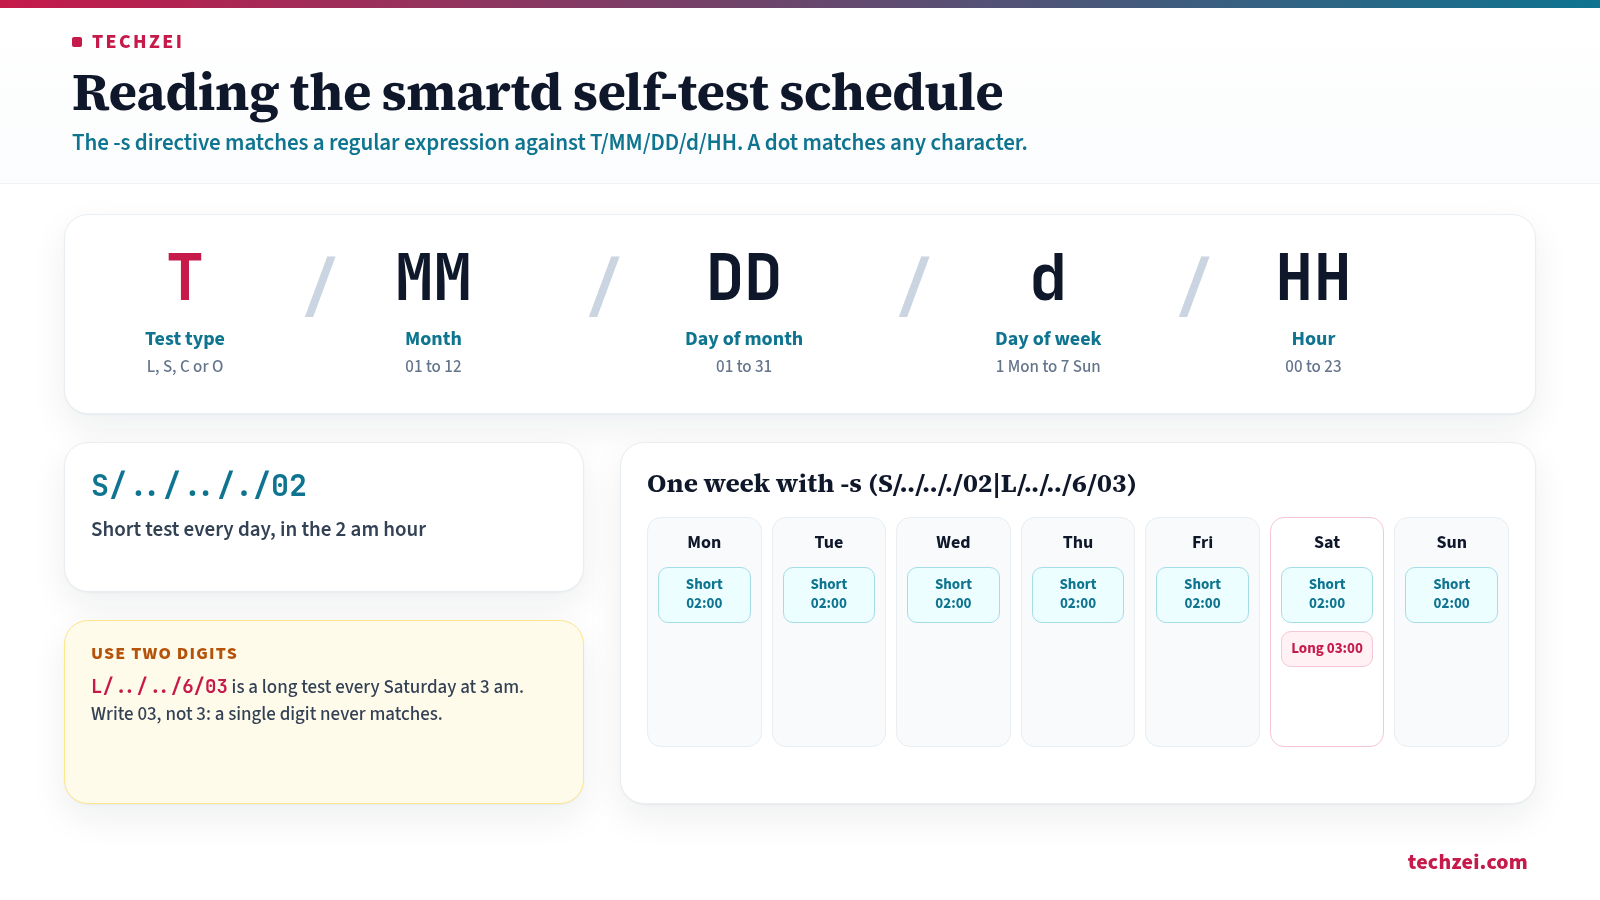
When two tests match the same hour, the longer one wins. To spread long tests across several disks, append a delay: L/../../6/03:002 starts each disk two hours after the previous one. smartd never starts a test on the first poll after boot, and keep long tests off your ZFS scrub or RAID check night, as the TrueNAS documentation also advises, because both read the whole disk.
Optional temperature alerts use -W: -W 4,45,55 logs 4-degree changes, notes 45°C and warns at 55°C. NVMe drives run hotter, so give them their own line or rely on their temperature warning bit.
Before restarting, ask smartd to show the schedule it will follow. This prints the next planned tests for every device without running any:
sudo smartd -q showtests
sudo systemctl restart smartmontools   # Fedora: sudo systemctl restart smartd
journalctl -u smartmontools -b         # Fedora: journalctl -u smartd -b
On smartmontools 7.4, smartd schedules self-tests on SATA and SAS disks only; scheduled NVMe tests arrived in 7.5 as an experimental feature. On Debian 13, install 7.5 from trixie-backports or keep NVMe on health monitoring, where most of its useful signal lives anyway.
Step 7: Get the alerts by email with msmtp
smartd does not send mail itself. On Debian and Ubuntu the runner calls every script in /etc/smartmontools/run.d/, and the packaged 10mail script pipes the warning into /usr/bin/mail. Without that command you get no email, only a log line asking for bsd-mailx or mailutils. The lightest fix is msmtp, a small SMTP client that hands mail to your provider:
sudo apt install msmtp msmtp-mta bsd-mailxmsmtp-mta provides the sendmail command that mail uses. Create /etc/msmtprc with your provider’s SMTP details. Many providers want an app password rather than your account password:
defaults
auth           on
tls            on
logfile        /var/log/msmtp.log
aliases        /etc/aliases

account        alerts
host           smtp.example.com
port           587
from           homeserver@example.com
user           homeserver@example.com
password       YOUR_APP_PASSWORD

account default : alerts
Then map local users such as root to your real address in /etc/aliases, and lock down the config because it holds a password:
root: you@example.com
default: you@example.com
sudo chmod 600 /etc/msmtprc
echo "msmtp works" | mail -s "Test from $(hostname)" rootOnce that arrives, add -M test to the end of your DEVICESCAN line and restart the service; smartd sends one test message per device at startup. Remove it afterwards, or every restart will repeat them. If nothing arrives, /var/log/msmtp.log and the smartd journal usually say why.
Step 8: Push alerts to your phone with ntfy
A phone notification is harder to miss than email. smartd passes each warning to the delivery program as environment variables, including SMARTD_DEVICESTRING, SMARTD_FAILTYPE (such as Health, CurrentPendingSector or SelfTest) and SMARTD_MESSAGE. On Debian, Ubuntu and Proxmox, add a second script next to 10mail so email keeps working:
#!/bin/sh
# /etc/smartmontools/run.d/20ntfy
curl -s -o /dev/null --max-time 10 \
  -H "Title: SMART warning on $(hostname)" \
  -H "Priority: urgent" \
  -H "Tags: warning" \
  -d "$SMARTD_DEVICESTRING ($SMARTD_FAILTYPE): $SMARTD_MESSAGE" \
  https://ntfy.sh/your-long-random-topic
sudo apt install curl
sudo chmod 755 /etc/smartmontools/run.d/20ntfy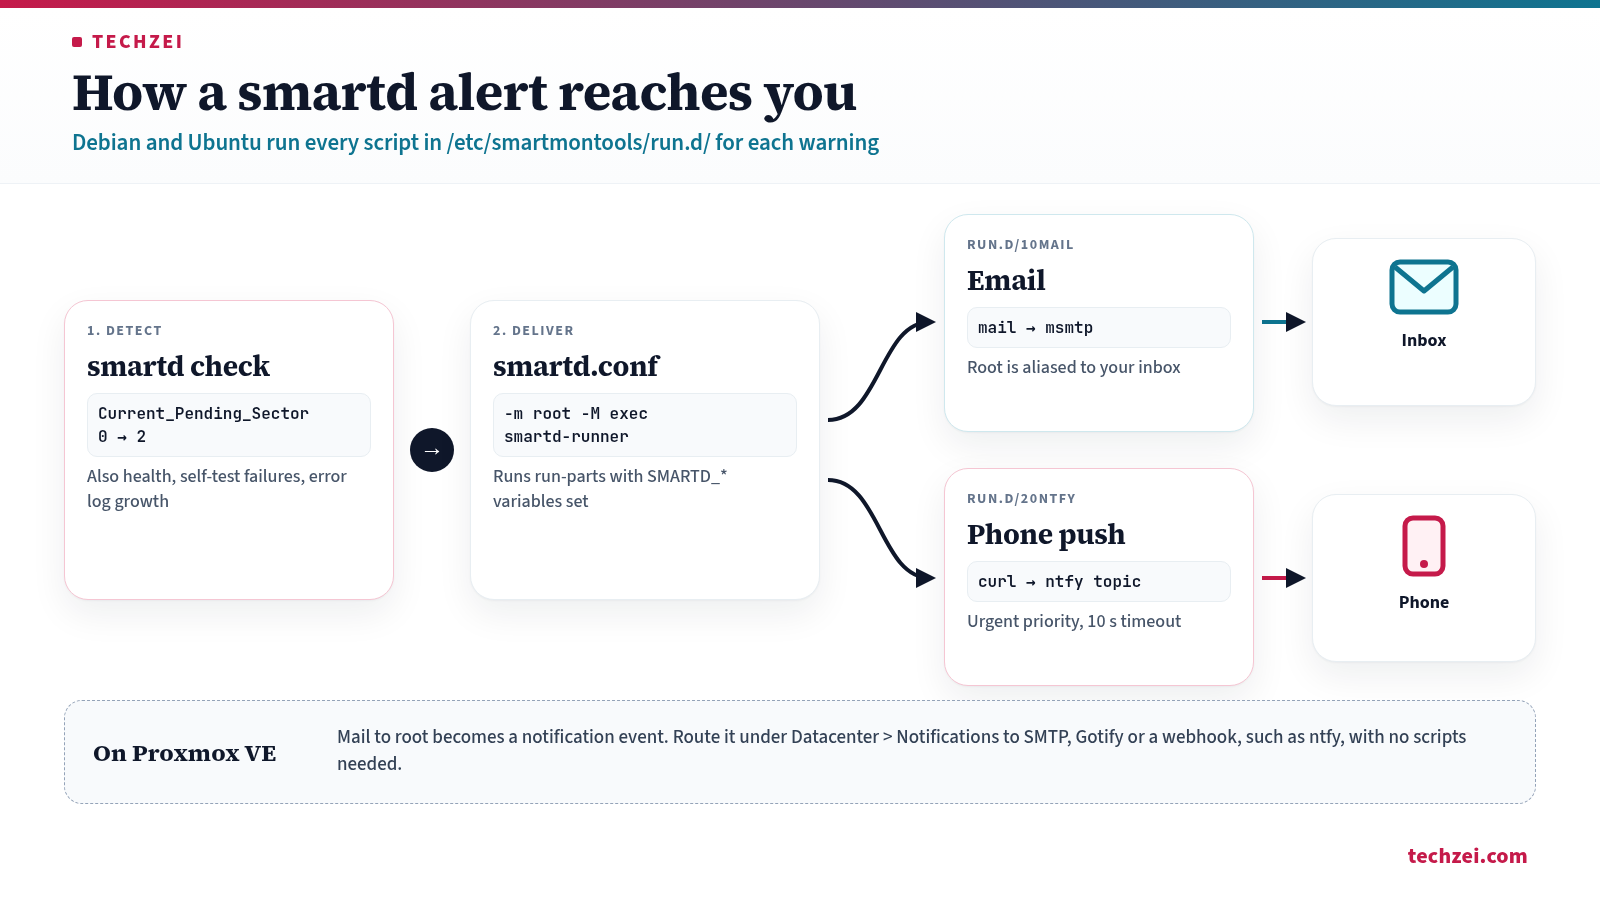
The headers come straight from the ntfy publishing docs. Treat a public ntfy.sh topic like a password and make it long and random, or use your own ntfy server with an access token. The smartd.conf manual adds two rules for hooked scripts: smartd waits for them to finish, so keep a timeout on network calls, and they should print nothing, which is why curl runs with -s -o /dev/null.
On other distributions, point -M exec at your own script instead, for example -m root -M exec /usr/local/bin/smartd-alert, with the same curl call inside. If you only want the push and no email, the manual’s special address -m <nomailer> runs the script without any mail arguments. On Proxmox you can skip the script entirely and add a webhook target for ntfy under Datacenter > Notifications, which the Proxmox admin guide documents with an ntfy example. If you already run Uptime Kuma, keep SMART alerts on their own topic so a drive warning does not drown in routine up and down messages.
Which SMART attributes actually predict failure
Backblaze has published some of the most useful public data on this. In its SMART stats analysis, it described using five raw values for years to decide when a drive needs investigating: 4.2% of working drives had at least one of them above zero, compared with 76.7% of failed drives.
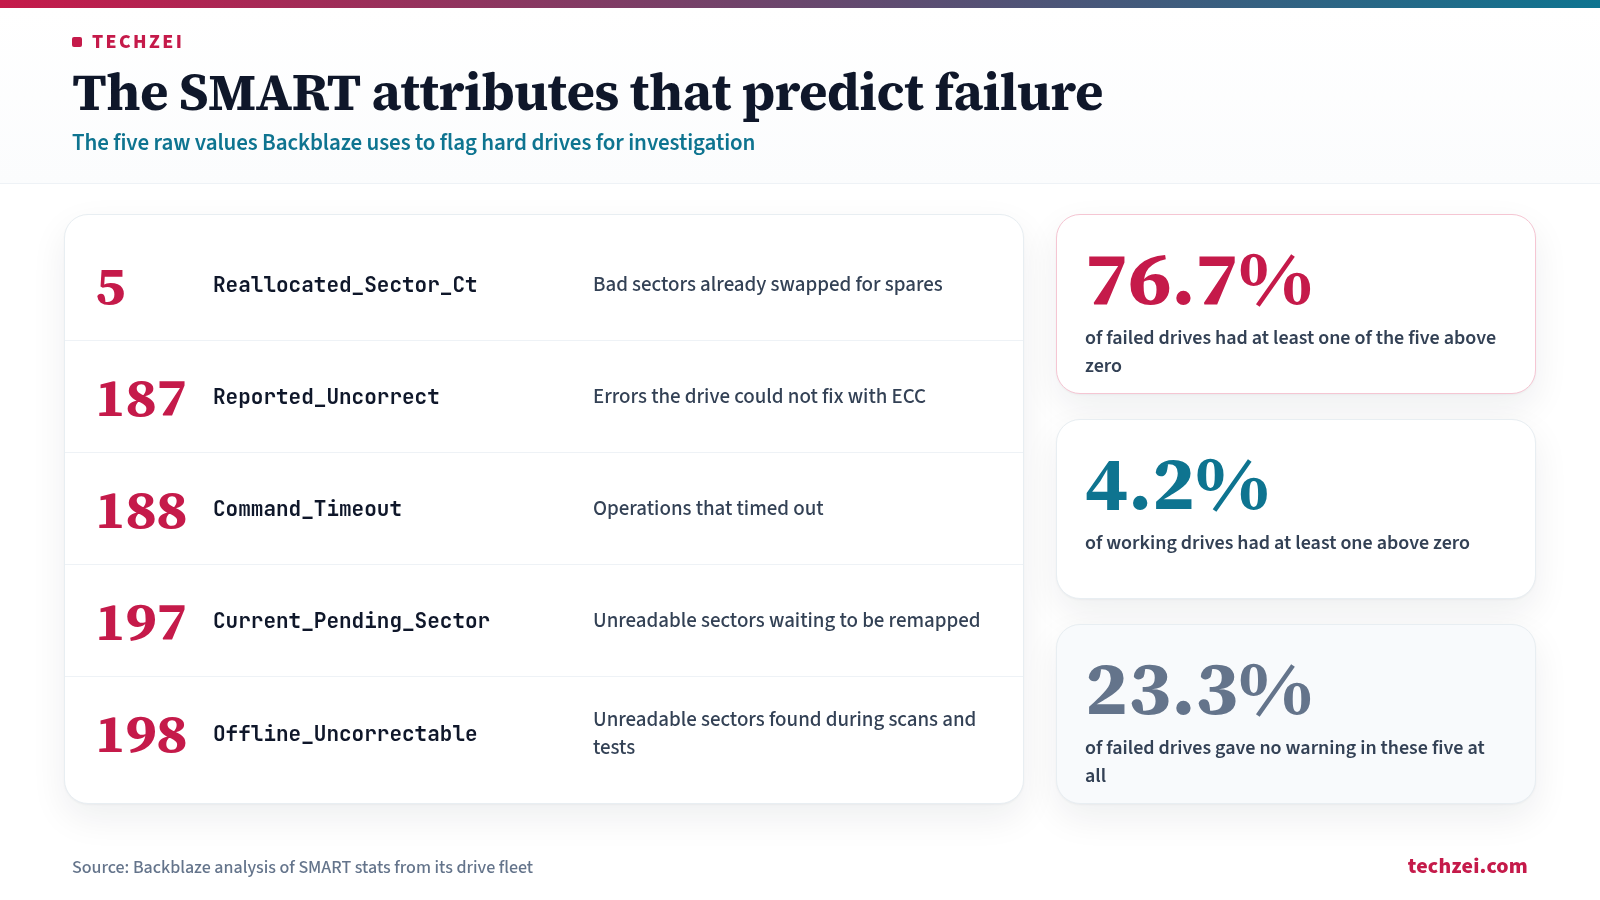
| ID or field | Name in smartctl | What it counts | When to worry |
|---|---|---|---|
| 5 | Reallocated_Sector_Ct | Bad sectors remapped to spare sectors | Any non-zero value is worth watching; a rising count means replace |
| 187 | Reported_Uncorrect | Errors the drive could not fix with ECC | Above zero, especially if it jumps suddenly |
| 188 | Command_Timeout | Operations that timed out | A rising count |
| 197 | Current_Pending_Sector | Unreadable sectors waiting to be reallocated | Above zero; smartd alerts on it by default |
| 198 | Offline_Uncorrectable | Sectors found unreadable during offline scans or self-tests | Above zero; smartd alerts on it by default |
| 199 | UDMA_CRC_Error_Count | Checksum errors on the link between disk and controller | A rising count points at the cable, backplane or port first |
| NVMe | Critical Warning | Six alarm bits defined by the NVMe spec | Any value other than 0x00 |
| NVMe | Available Spare | Remaining spare capacity | At or near Available Spare Threshold |
| NVMe | Percentage Used | Estimated endurance consumed | Plan a replacement as it approaches 100 |
| NVMe | Media and Data Integrity Errors | Unrecovered data integrity errors | Any increase |
Backblaze adds three points. One non-zero value can mean little: its own example is a drive with 2 reallocated sectors. The attributes are mostly independent except 197 and 198, so 5 and 197 together is more worrying than 197 and 198 together. And timing matters: all five except 197 are cumulative, so a drive that jumps from 0 to 20 uncorrectable errors in a day is in worse shape than one that collected 60 over five years.
My take: on a home server, act on the five Backblaze attributes and any NVMe critical warning, and treat 199 as a cabling clue rather than a dying disk. smartd’s -a already alerts on 197 and 198 and tracks changes in the others. On SATA SSDs, wear attributes are vendor specific, so check what your model reports with smartctl -x.
What to do when an attribute moves
- Check your backup first. Before running anything heavy on a suspect drive, make sure the 3-2-1 restic backup or other off-machine copy is current. A long test or resilver puts a weak drive under heavy load.
- Run a long self-test with
smartctl -t longand read the log afterwards. A read failure with an LBA confirms a real surface problem. - Check the redundancy layer. See whether
zpool statusorcat /proc/mdstatshows errors on the same disk. - Watch the trend for a week. Pending sectors (197) are not cumulative: the count can fall once a sector is rewritten and recovers or is reallocated, though the smartd.conf manual notes some disks never reset it. A count that keeps climbing is the signal to act.
- Rule out the cheap causes. CRC errors (199) are counted on the link, not the platters, so a loose or damaged SATA cable or backplane slot is the first suspect. Reseat or swap it and see whether the count stops.
- Replace the drive when reallocated and pending counts keep rising, a long test fails, an NVMe Critical Warning bit is set, or Available Spare falls below its threshold. If it is under warranty, the manufacturer’s own diagnostic tool may be needed for the claim.
The FAQ notes that writing to an unreadable sector forces the drive to fix or reallocate it, but that write destroys the sector’s data. On a ZFS mirror or RAID-Z, let a scrub rewrite the block from a good copy; on a single disk, copy your data off instead of repairing.
Troubleshooting smartctl and smartd
| Problem | Likely cause | Fix |
|---|---|---|
| “Unable to detect device type” on a USB disk | The bridge needs a hint or does not pass SMART through | Try -d sat, or -d sntjmicron, sntrealtek or sntasmedia for NVMe enclosures; some bridges cannot be read |
| smartd will not start in a VM or LXC container | Debian’s unit has ConditionVirtualization=no; virtual disks have no SMART | Run smartd on the host that owns the disks |
| No email arrives | /usr/bin/mail missing, or msmtp not configured | Install bsd-mailx and msmtp-mta, check /var/log/msmtp.log, test with -M test |
| Scheduled tests never run | Single-digit month, day or hour in the -s regex | Use two digits for each; check with smartd -q showtests |
| Long test shows “Aborted by host” or “Interrupted (host reset)” | The host put the drive into standby, common behind USB bridges | Disable spin-down for the test window or move the disk to SATA |
| Same warning email every day | Daily reminders are the default when state persistence is on, as in Debian’s build | Add -M once or -M diminishing after fixing or accepting the issue |
| smartd log says temperature changed from 78 to 77 | That is the normalised value, not degrees | Add -I 194 to stop tracking it and use -W for real temperature alerts |
| NVMe self-test command rejected | smartctl older than 7.4, or the drive lacks self-test support | Update smartmontools; check smartctl -c output for supported commands |
FAQ
How often should self-tests run?
Debian’s smartmontools documentation passes on upstream’s advice: a short test every day and a long test once a week. On very large or busy drives, a long test every two weeks or monthly is a reasonable compromise, as long as it does not clash with your scrub.
Does a long self-test replace a ZFS scrub?
No, they check different things. A self-test asks the drive whether it can read its own sectors. A scrub reads your actual data and verifies every block against its checksum, then repairs bad copies from redundancy. Run both, on different days.
Can I monitor drives inside a Proxmox VM or container?
Not usefully. Virtual disks do not expose SMART, and smartd’s Debian unit refuses to start under virtualisation. Monitor the disks on the Proxmox host, where smartd is already running, and route alerts through Proxmox notifications. A VM with a passed-through disk controller is the exception, though the unit file’s own comment says you then need to override its virtualisation check.
- Sourcesmartd.conf(5) manual
- Sourcesmartctl(8) manual