Uptime Kuma can tell you when a home server app or backup job fails, even if you are away from the dashboard. It is a free, open-source, self-hosted monitor that checks websites, ports, DNS records and Docker containers on a schedule, then pings your phone through Telegram, ntfy, Discord, email or one of more than 90 other notification services when something goes down.
A home lab also needs to monitor jobs that have no web page. A nightly backup script, a cron job or a certificate that quietly expires will never answer an HTTP check. Uptime Kuma handles those with Push monitors (a heartbeat your job sends when it finishes) and built-in certificate expiry alerts. That catches failures an ordinary website check would miss.
Version 2.5.9, released on 31 October 2026, includes a security fix for an RSS cache poisoning issue plus a fix for how Push monitors reset their retries, so it is a good moment to install fresh or update.
What Uptime Kuma does, and what it does not
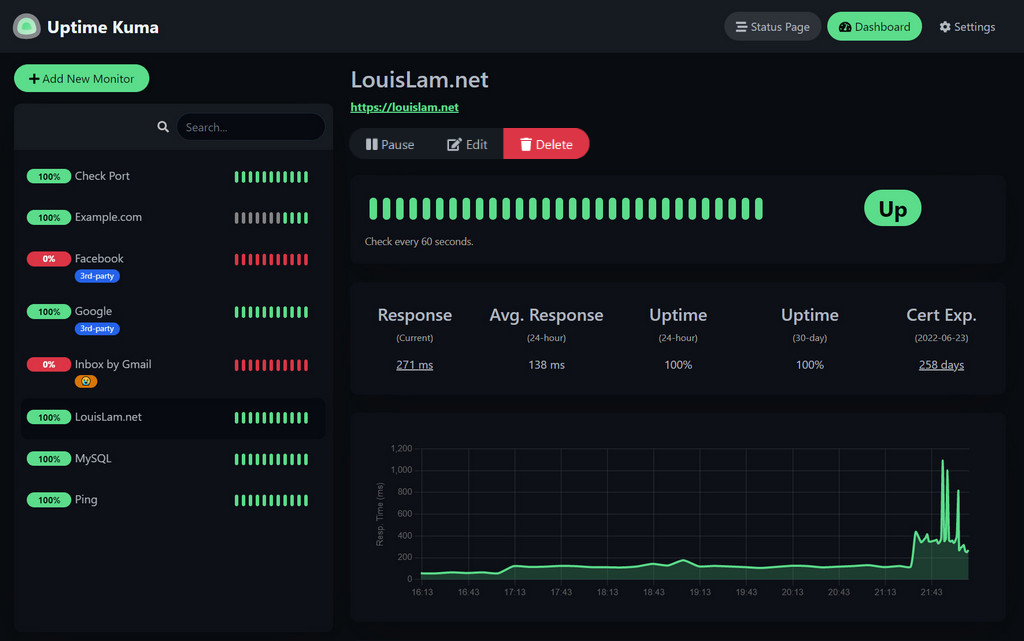
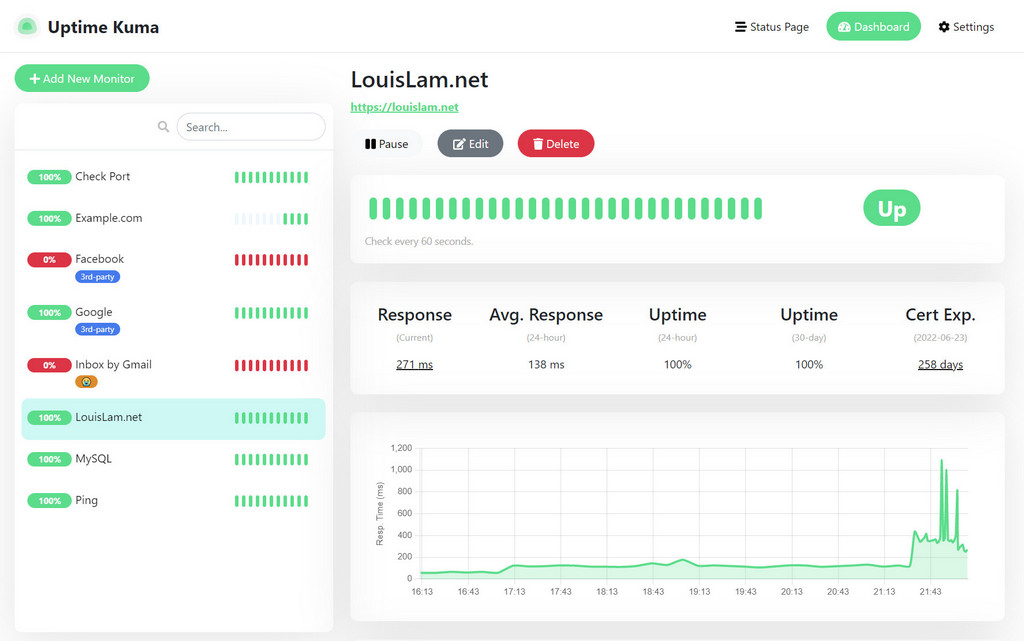
Uptime Kuma is an availability monitor. Every monitor runs a check at a set interval (60 seconds by default), records the result as a heartbeat, and changes state to Down when a check fails more times than you allow. You get a dashboard with response-time graphs and uptime percentages, plus optional public status pages.
It is not a metrics stack. It will not graph CPU temperature, disk usage or RAM the way Prometheus and Grafana do, and it does not collect logs. Think of it as the smoke alarm, not the full building management system. For most home servers, a smoke alarm is exactly what is missing.
| Monitor type | What it checks | Good home-lab use |
|---|---|---|
| HTTP(s) | A URL returns a successful status code | Immich, Home Assistant, Nextcloud, a router admin page |
| HTTP(s) Keyword / JSON Query | The response contains text or a JSON value you expect | An API health endpoint that returns “ok” |
| TCP Port | A port accepts connections | SSH on a NAS, a game server, a database |
| Ping | The host answers ICMP | Access points, a switch, a Raspberry Pi |
| DNS | A record resolves to the value you expect | Your Pi-hole or a dynamic DNS hostname |
| Docker Container | A named container is running | Every container on a self-hosting box |
| Push | Your own script sends a heartbeat on time | Backups, cron jobs, scheduled scripts |
The full list is longer and also includes WebSocket, Steam game servers and several database types, but the seven above cover nearly every home setup.
Before you start: where to run it
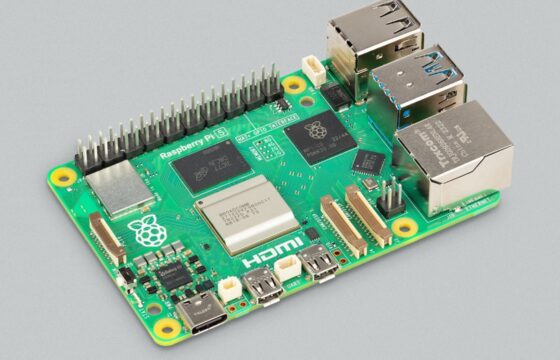
The one rule that trips people up: do not run your monitor on the same machine as everything it monitors. If your only server loses power, Uptime Kuma goes down with it and nobody gets an alert. A cheap separate device (a Raspberry Pi, an old laptop or a small cloud VM) is the better home. If you run Proxmox, an LXC container on a different node works too. Our guide to installing Proxmox VE covers creating that container.
Uptime Kuma runs on Linux, Windows and macOS. The official project recommends Docker, and the non-Docker route needs Node.js 20.4 or newer. You need about one port (3001 by default) and a small amount of storage for the SQLite database in the data folder. If you are still planning the hardware itself, our home server and NAS beginner’s guide walks through the options.
One warning from the project wiki applies to everyone: the data folder must be on local storage. Network shares such as NFS are not supported for the database because of file-locking problems, so keep it on the machine’s own disk.
Step 1: Install Uptime Kuma with Docker Compose
Docker Compose is the cleanest choice because the whole configuration lives in one file you can back up. Create a folder and a compose.yaml file in it:
mkdir -p ~/uptime-kuma && cd ~/uptime-kuma
nano compose.yaml
Paste the official compose file. The :2 tag tracks the current 2.x release line:
services:
  uptime-kuma:
    image: louislam/uptime-kuma:2
    restart: unless-stopped
    volumes:
      - ./data:/app/data
    ports:
      # <Host Port>:<Container Port>
      - "3001:3001"
Start it:
docker compose up -dOpen http://SERVER-IP:3001 in a browser. On the first visit Uptime Kuma asks you to choose a database and create an admin account. SQLite is a straightforward choice for a small home setup. Use a long, unique password, because this account can see every service you run.
If you prefer a single command, the official equivalent is:
docker run -d --restart=unless-stopped -p 3001:3001 -v uptime-kuma:/app/data --name uptime-kuma louislam/uptime-kuma:2If you only want the dashboard reachable from the machine itself (for example because a reverse proxy will sit in front of it), bind the port to localhost by changing the port line to “127.0.0.1:3001:3001”.
Install without Docker
On a machine where you would rather not run Docker, the project supports a plain Node.js install managed by PM2:
git clone https://github.com/louislam/uptime-kuma.git
cd uptime-kuma
npm run setup

# run in the background with PM2
npm install pm2 -g && pm2 install pm2-logrotate
pm2 start server/server.js --name uptime-kuma
pm2 save && pm2 startup
Docker is still the easier path to keep updated, which matters for a tool that sees your whole network.
Step 2: Add your first monitors
Click Add New Monitor. Every monitor shares the same core settings, and getting them right is the difference between useful alerts and alert fatigue.
- Monitor Type: pick from the table above.
- Friendly Name: what shows up in alerts, so make it readable, such as “Immich (NAS)”.
- Heartbeat Interval: how often to check. 60 seconds is the default and fine for most services.
- Retries: how many failed checks before the monitor goes Down and a notification is sent. Uptime Kuma 2.x sets this to 0 for new monitors, which means a single failed check alerts you. For services on Wi-Fi or a busy NAS, 2 or 3 retries avoids false alarms.
- Heartbeat Retry Interval: how quickly to recheck after a failure. A shorter value here, such as 20 seconds, confirms a real outage faster.
- Resend Notification if Down X times consecutively: leave at 0 for one alert per outage, or set a number to get reminders.
A sensible first set for a typical home: your router or gateway (Ping), your DNS server (DNS monitor checking a known domain), each web app you self-host (HTTP), SSH on your NAS (TCP Port 22) and one external site such as your ISP’s or a public website, so you can tell a home outage from an internet outage.
For an HTTP monitor on an app that uses a self-signed certificate, tick “Ignore TLS/SSL errors for HTTPS websites” only if you understand why the certificate is not trusted. For anything public, leave it off so certificate problems show up as failures.
Monitor Docker containers directly
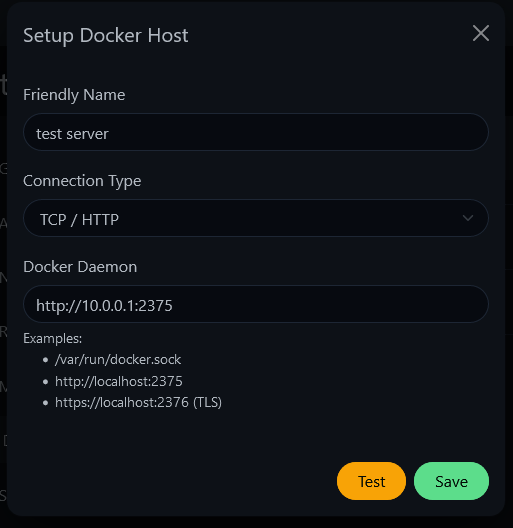
The Docker Container monitor checks whether a named container is running, which catches the classic failure where a container crashes in a restart loop while the host stays up. Uptime Kuma needs access to the Docker daemon for this, so add the socket to the compose file:
    volumes:
      - ./data:/app/data
      - /var/run/docker.sock:/var/run/docker.sock
Then go to Settings, Docker Hosts, add a host with the socket path /var/run/docker.sock, and pick containers by name when creating monitors.
Be clear about the risk. The official documentation warns that sharing the Docker socket gives Uptime Kuma full control of the Docker daemon, and if the container were compromised an attacker could take over the host. The project does not recommend exposing Uptime Kuma to the internet when you use this monitor type. If you want both public status pages and container monitoring, keep the admin interface on your LAN or behind a VPN.
Step 3: Set up notifications that reach your phone
Monitors without notifications are just a dashboard you forget to open. Go to Settings, Notifications, Setup Notification. Uptime Kuma supports more than 90 services; three work especially well for home users:
| Service | Setup effort | Why pick it |
|---|---|---|
| Telegram | Create a bot with @BotFather, paste the token and your chat ID | Free, instant, works well on Android and iPhone |
| ntfy | Pick a topic name, install the ntfy app and subscribe | No account needed; can be self-hosted too |
| Email (SMTP) | Enter SMTP server, port and app password | Good as a second channel or for a shared inbox |
For Telegram, the setup form has an Auto Get button that fills in your chat ID after you send your new bot a message. For ntfy, use a long random topic name, because anyone who guesses a public topic can read your alerts.
Two options save time. “Default enabled” attaches the notification to every new monitor automatically, and “Apply on all existing monitors” adds it to the ones you already created. Always press Test before saving, so you know the alert actually lands.
If you upgraded from 1.x and use email, note that 2.x switched email subject and body templates to LiquidJS, and variable names are now case-sensitive. Custom templates that used different capitalisation will render blank fields until you fix them.
Step 4: Monitor backups and cron jobs with Push monitors
This is where Uptime Kuma earns its place in a home lab. A backup job that silently stops running is far more dangerous than a web app that goes down, because you only find out when you need to restore. A Push monitor flips the logic: instead of Uptime Kuma checking a service, your job checks in with Uptime Kuma, and silence means failure.
- Add a new monitor and choose Push as the type.
- Set the Heartbeat Interval to a little longer than your job’s schedule. For a nightly backup, use about 25 hours (90000 seconds), so a slow run does not trigger a false alarm.
- Save and copy the Push URL. It looks like https://kuma.example.com/api/push/TOKEN?status=up&msg=OK&ping=
- Call that URL at the end of your job, only when the job succeeds.
A simple pattern for a shell script uses the exit status so failures report Down straight away instead of waiting for the timeout:
#!/bin/sh
PUSH="https://kuma.example.com/api/push/TOKEN"

if /usr/local/bin/backup.sh; then
  curl -fsS -m 10 --retry 3 "$PUSH?status=up&msg=OK" > /dev/null
else
  curl -fsS -m 10 --retry 3 "$PUSH?status=down&msg=backup%20failed" > /dev/null
  exit 1
fi
The endpoint reads three optional query parameters: status (up by default), msg (OK by default) and ping, a number in milliseconds you can use to record how long the job took. In the current code, an explicit status=down skips the retry logic and marks the monitor Down immediately, which is exactly what you want for a failed backup.
This works with any tool that can make an HTTP request: restic or Borg scripts, a Proxmox backup hook, a Home Assistant automation, or a Windows Task Scheduler job using curl.exe. If you moved your photo library to a self-hosted server using our Google Photos to Immich guide, a Push monitor on the nightly backup of that library is probably the single most valuable alert you can set up.
Certificate expiry alerts
Every HTTPS monitor can also warn you before its certificate expires. Open the monitor and enable Certificate Expiry Notification. Uptime Kuma then sends alerts at the thresholds set under Settings, Notifications, which default to 7, 14 and 21 days before expiry. That catches the common home-lab failure where a Let’s Encrypt renewal broke months ago and nobody noticed until a browser warning appeared.
Step 5: Build a status page
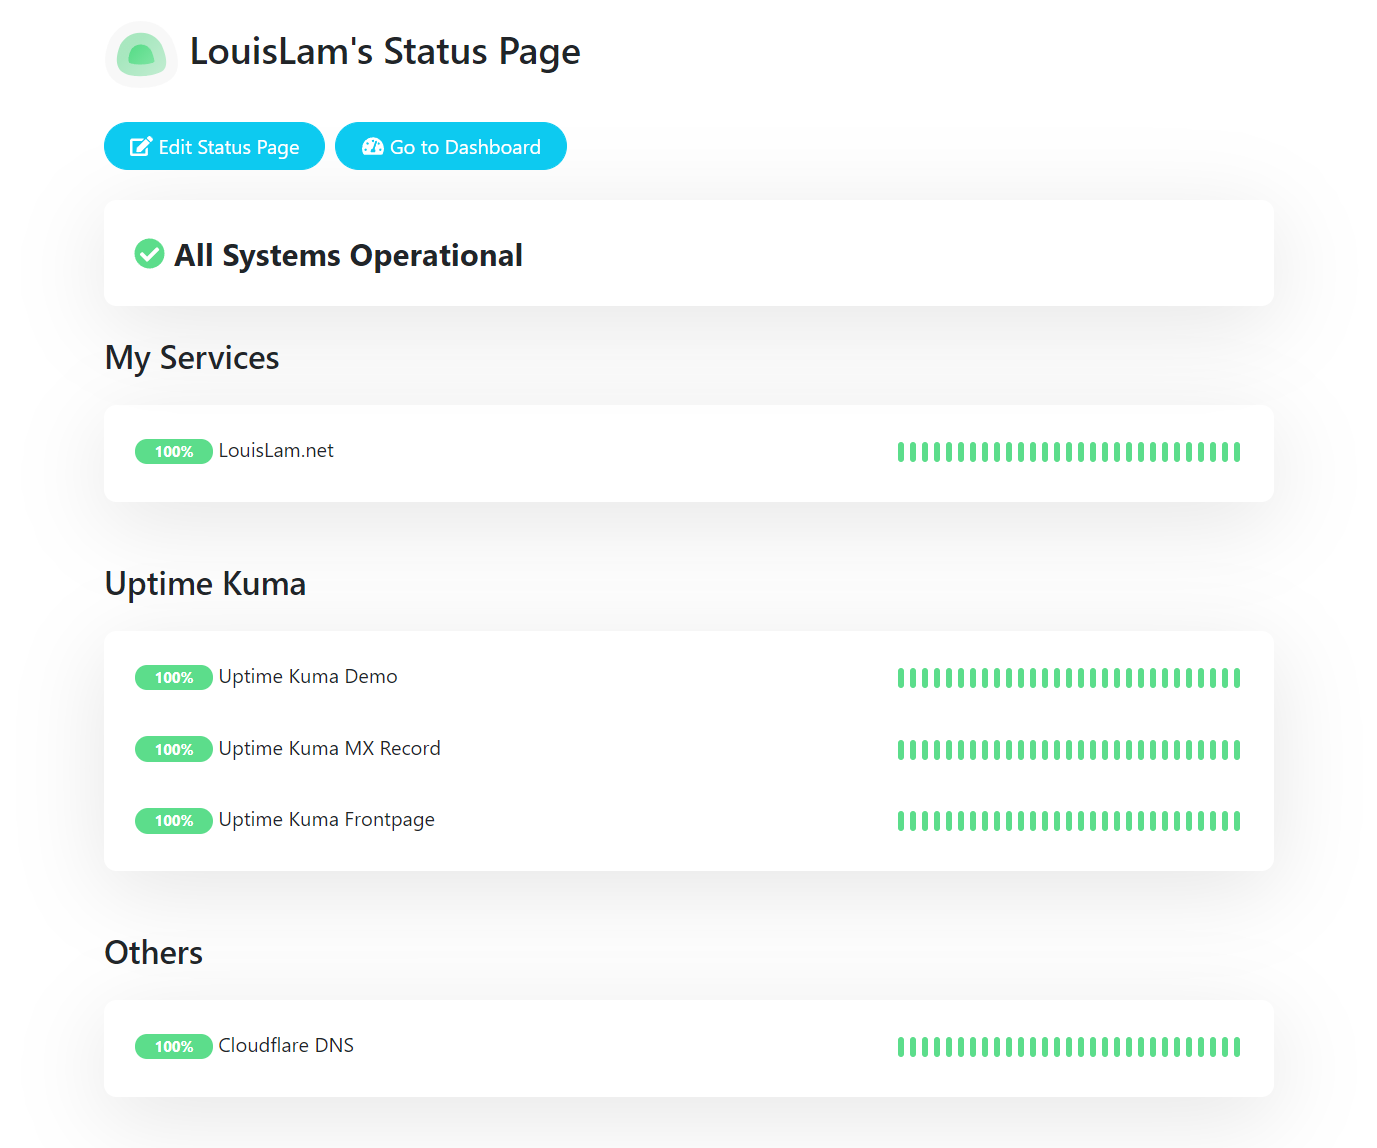
Status pages are a read-only view of selected monitors that you can share without giving anyone an account. They are handy for family members (“is the media server down, or is it my phone?”) or for a small office.
- Click Status Pages, then New Status Page, and give it a name and a URL slug.
- Add groups, such as “Media” and “Network”, and drag monitors into them.
- Optionally add a description, footer text and a logo, then Save.
The page is served at http://SERVER-IP:3001/status/your-slug. Only the monitors you add appear, and nobody can change anything from it.
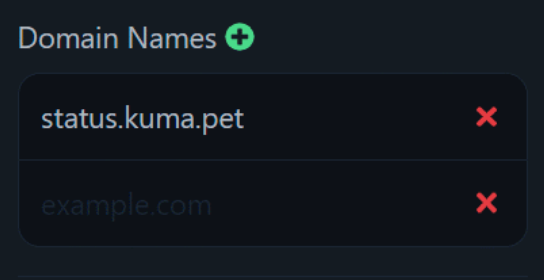
You can also attach a domain name to a status page, so status.example.com shows it directly. Point that domain at Uptime Kuma (normally through your reverse proxy), then add it in the status page’s Domain Names setting.
For planned work, use Maintenance from the top menu. A maintenance window pauses notifications for the monitors you select and shows a message on the status pages they appear on, so a weekend NAS upgrade does not flood your phone.
Step 6: Access it securely from outside your home
The safest option is not to expose the admin interface at all and reach it over a VPN such as Tailscale or WireGuard. If you need a public status page, the project supports two approaches.
A reverse proxy. Uptime Kuma uses WebSockets, so your proxy must pass the Upgrade and Connection headers, and it must be on its own domain or subdomain because subdirectories like example.com/uptime are not supported. The official Nginx example:
server {
  listen 443 ssl http2;
  server_name status.example.com;
  ssl_certificate     /path/to/cert.crt;
  ssl_certificate_key /path/to/key.key;

  location / {
    proxy_set_header   X-Real-IP $remote_addr;
    proxy_set_header   X-Forwarded-For $proxy_add_x_forwarded_for;
    proxy_set_header   Host $host;
    proxy_pass         http://localhost:3001/;
    proxy_http_version 1.1;
    proxy_set_header   Upgrade $http_upgrade;
    proxy_set_header   Connection "upgrade";
  }
}
If Uptime Kuma is only reachable through the proxy, set Settings, Reverse Proxy, Trust Proxy to Yes so the logs show real client IP addresses.
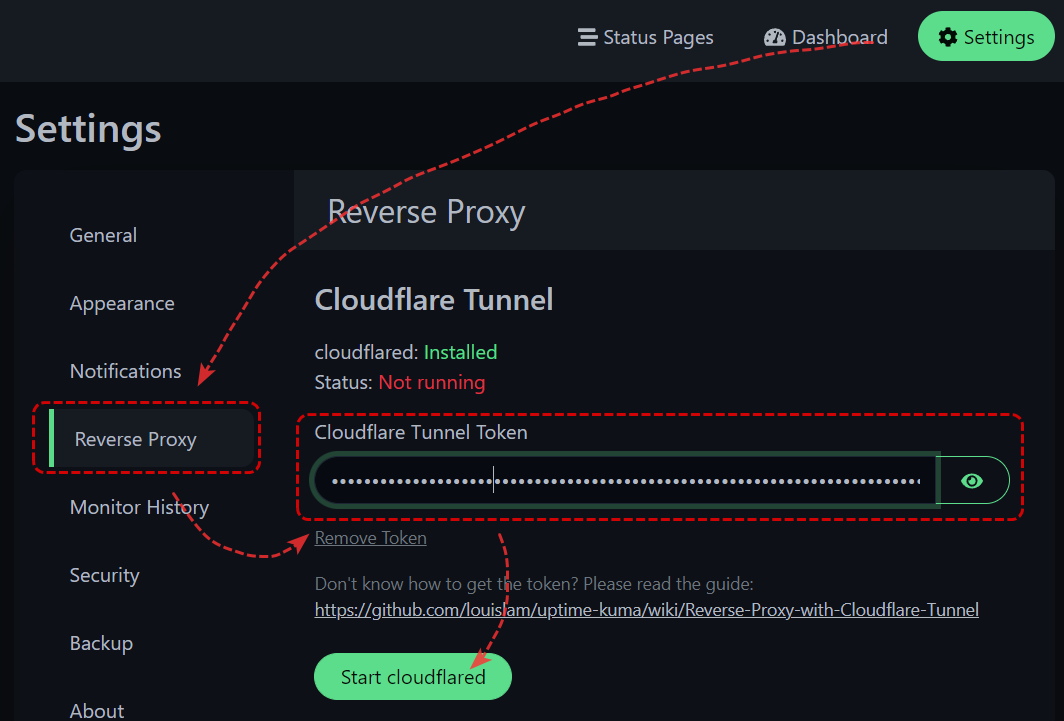
Cloudflare Tunnel. Uptime Kuma has a built-in cloudflared client. Create a tunnel in Cloudflare Zero Trust, copy the token, paste it into Settings, Reverse Proxy, Cloudflare Tunnel Token and click Start cloudflared. Then map your hostname to http://localhost:3001 in Cloudflare. This works even behind carrier-grade NAT, which is common on Indian fibre and mobile broadband connections, because the tunnel connects outward from your network.
Whichever you choose, turn on two-factor authentication under Settings, Security before the dashboard is reachable from the internet.
Back up and update Uptime Kuma
Uptime Kuma 2.x removed the old JSON export and import feature. The project now says backing up the data directory is the only supported backup method. With the compose file above, that is the ~/uptime-kuma/data folder. Stop the container briefly for a consistent copy of the SQLite database:
cd ~/uptime-kuma
docker compose stop
tar czf ~/uptime-kuma-backup-$(date +%F).tar.gz data compose.yaml
docker compose start
To update a Docker Compose install:
cd ~/uptime-kuma
docker compose pull
docker compose up -d --force-recreate
Heartbeat history is kept for 365 days by default. You can lower that under Settings, Monitor History if the database grows large on a small SD card.
Upgrading from Uptime Kuma 1.x
Moving from 1.x to 2.x is a major upgrade with breaking changes. The official migration guide asks you to stop the service and back up the data directory first, and warns that the database migration can take a long time because it rewrites heartbeat history into a new format. The maintainer reports about seven minutes for 20 monitors with 90 days of data, and hours are possible on slow hardware. Do not interrupt it; an interrupted migration means restoring from backup and starting again. Change the image tag from :1 to :2 only after that backup exists.
Common problems and fixes
| Symptom | Likely cause | Fix |
|---|---|---|
| Dashboard loads but keeps disconnecting behind a proxy | WebSocket headers missing | Add the Upgrade and Connection headers shown above |
| Constant false Down alerts | Retries set to 0 on a flaky link | Raise Retries to 2 or 3 and shorten the retry interval |
| Push monitor shows Down every morning | Heartbeat interval shorter than the job schedule | Set the interval longer than the job’s gap, with some slack |
| Docker monitor cannot connect | Socket not mounted or wrong path | Mount /var/run/docker.sock and check the Docker host setting |
| Database errors or corruption | Data folder on a network share | Move the data folder to local disk |
| Status page at /uptime path does not work | Subdirectories are not supported | Use a subdomain instead |
Where to start
If your household relies on a self-hosted service, start with a monitor for that service and a Push monitor for its backup. HTTP checks tell you a service is down, which you would often notice yourself. A Push monitor on your backups tells you about a failure you would otherwise discover on the worst possible day. Run it on a separate small device, start with retries at 2 so alerts stay meaningful, and keep the admin side off the public internet unless you really need it.
FAQ
Is Uptime Kuma free?
Yes. It is open source under the MIT licence and has no paid tier. You only pay for the hardware or VM you run it on.
Can Uptime Kuma monitor servers outside my home network?
Yes. Any HTTP, TCP, Ping or DNS target the machine can reach is fair game, including public websites and cloud servers. Running a second copy on a cheap cloud VM to watch your home from outside is a common setup, since it can alert you when your whole connection goes down.
Does Uptime Kuma show CPU, RAM or disk usage?
No. It tracks availability and response time. For resource metrics, pair it with a tool such as Netdata or Prometheus and Grafana, or point a Push monitor at a script that only reports up when disk space is above a threshold.
How much hardware does it need?
Very little. A Raspberry Pi or a small container handles dozens of monitors at 60-second intervals comfortably. The database grows with the number of monitors and the history you keep, so trim the retention period on small storage.
Is it safe to expose Uptime Kuma to the internet?
It can be, behind HTTPS with two-factor authentication, but a VPN is safer for the admin interface. Never expose it publicly while the Docker socket is mounted, as the official documentation warns.
- SourceUptime Kuma on GitHub
- SourceUptime Kuma update guide
- SourceUptime Kuma status pages