


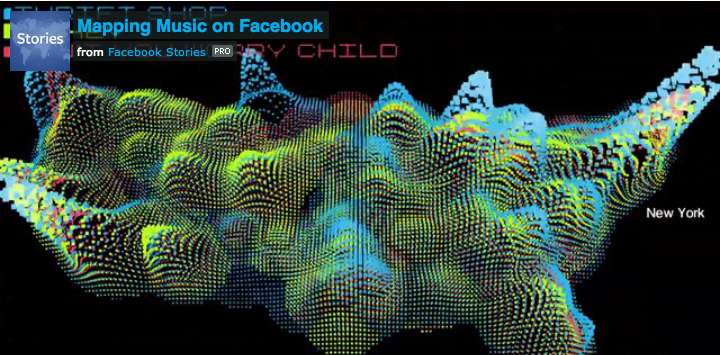
Inspired by old-school graphic equalizers, this Beatquake maps the volume of listens for each of the top three most popular songs in the U.S. each day over a period of 90 days.
Colored layers, each representing one song, rise and fall over geographic locations to correspond with the number of plays in that area. The texture of the map is driven by BPMs (beats per minute) and changes as one song overtakes another in popularity.
For this project, Facebook partnered with Stamen, a design and technology studio in San Francisco specializing in maps and data visualizations. (You can read more about their creative process here, or, for a technical behind-the-scenes look at what powers this map, visit their blog.)
(From Facebook Stories)
As you watch the video, here are a few moments to look for:
Plays of Scream & Shout by will.i.am & Britney Spears erupt in New York City on February 9.

A few days later, Scream & Shout explodes in the South, just after the song’s Valentine’s Day video release.
Swedish House Mafia’s Don’t You Worry Child takes off in Texas on February 22.
Chicago goes nuts for Thrift Shop around March 12.